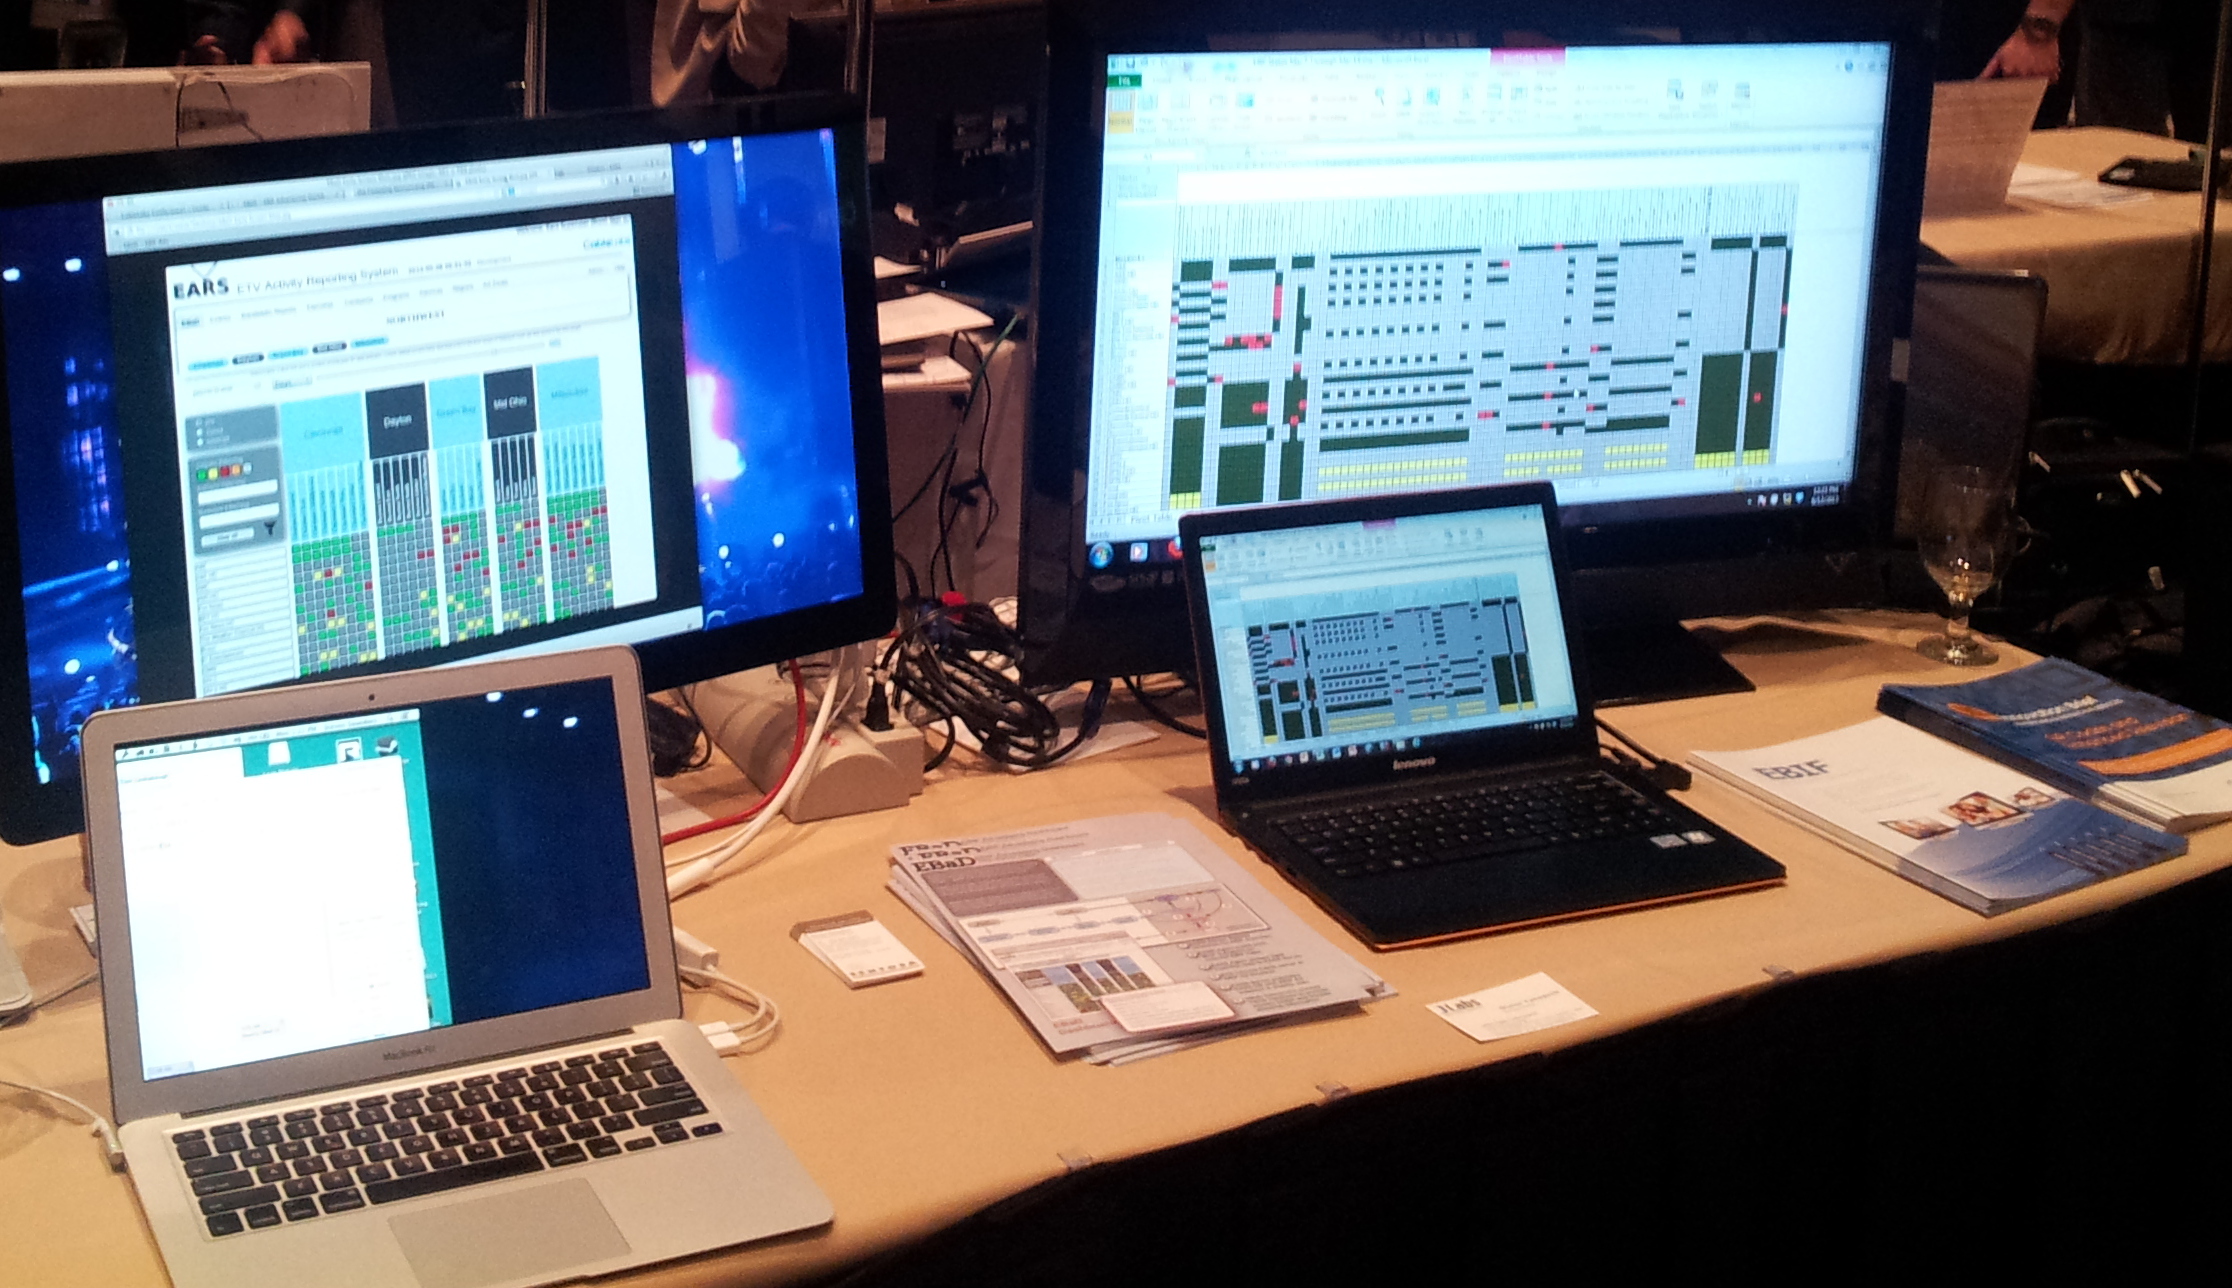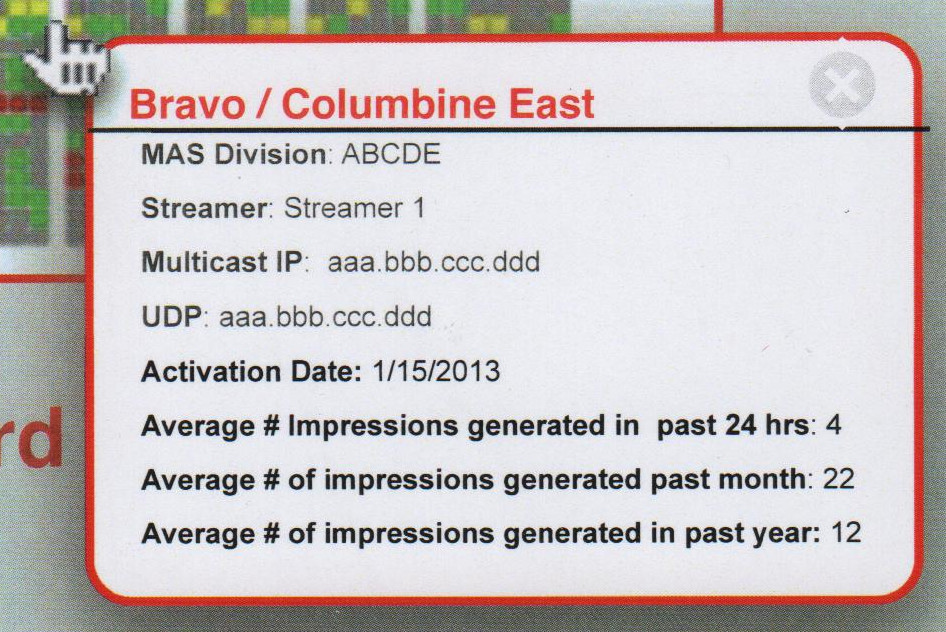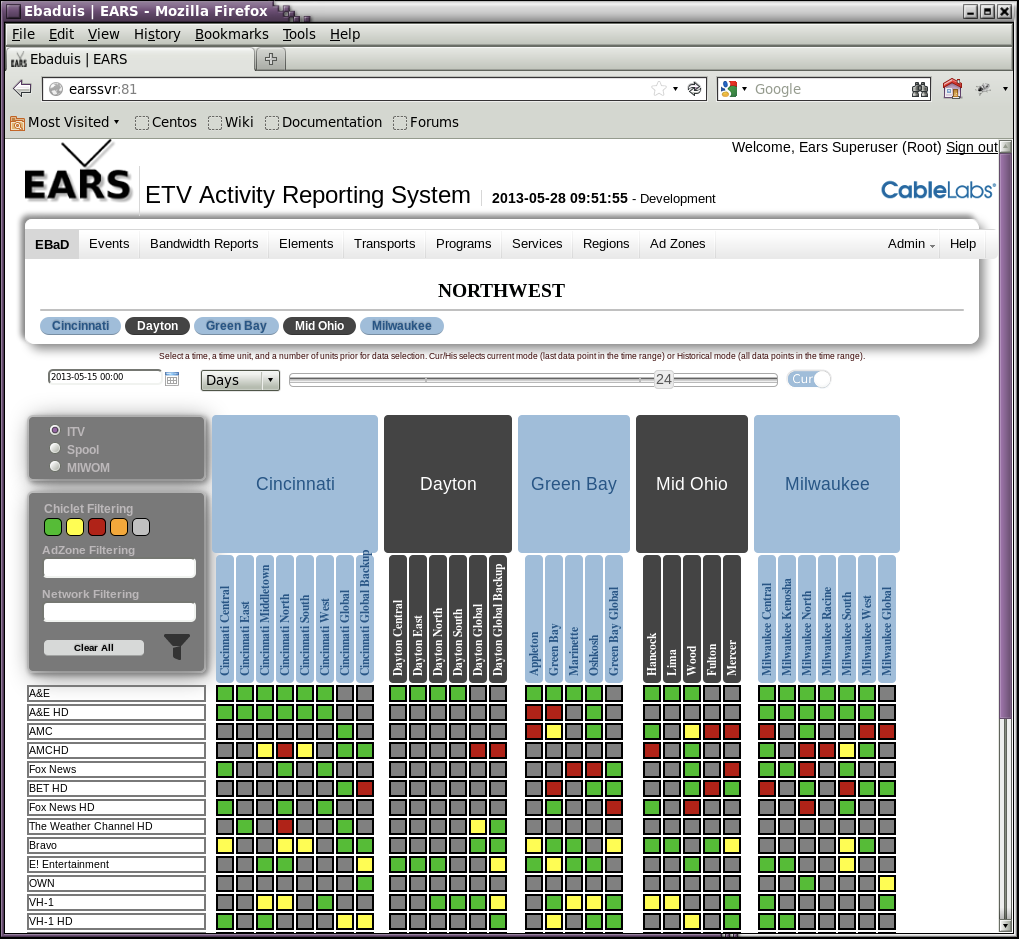


To the left you can see the EBaD interface, as shown at the CableLabs Summer Conference in 2013. Also see the pic below. This interface gave the client an instant view of how well ETV advertisements were making it from the cable operator's office to the home viewer's cable box. Delivery markets and regions within the markets could be added or removed or reordered to suit the user's needs. Clicking on a colored "clicklet" gave details on the specific performance on a channel being provided to the market/region (see right).
In this case, the user interface was generated by a Ruby application that worked with of data generated by the EARS server, which we created with CableLabs and Sentosa. The EARS server is fed data by EARS Agents that monitor the data streams throughout the cable operator's plants, which then gets organized and put into a database for analysis such as that performed by the EBaD interface. Please see our Servers page for more information on the EARS server.
